Dashboard & Statistics
After signing in, you land on the dashboard — your account's home screen. It gives you a quick overview of the current state of all your events.
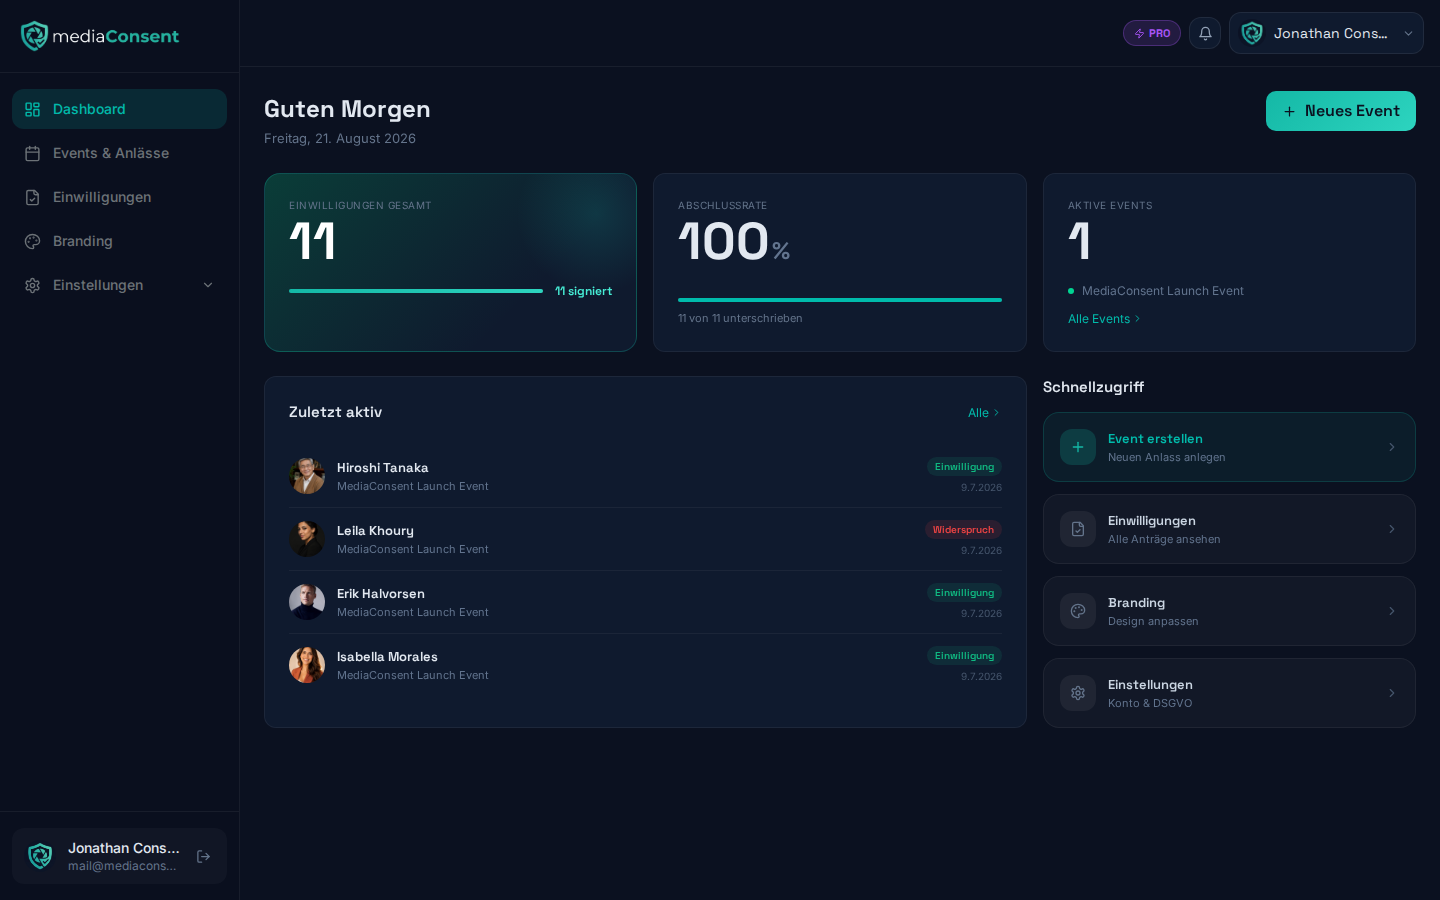
Key metrics
At the top you'll see three tiles:
- Total consents — number of all consents and refusals collected across all events, including the completion rate (share of signed vs. open consents).
- Completion rate — percentage of completed (signed) consents.
- Active events — number of events with status "active", with a short list of the last two.
Activity feed
Below that you'll find the four most recently submitted consents or refusals, with name, event, and timestamp ("5 minutes ago", "yesterday", …). Clicking an entry opens the detail view of that consent. The metric tiles are clickable too and lead to a matching filtered view in Manage Consents.
Quick actions
On the right you'll find shortcuts to the most common actions:
- Create a new event
- View consents
- Edit branding
- Open settings
Missing legal information notice
As long as your required fields under Privacy Settings are incomplete (e.g. a missing address or contact email), the dashboard shows a warning banner with a direct link to fill them in.
Event statistics
On each event's detail page you'll also find event-specific metrics: total, signed, and revoked consents, plus the number of active gallery shares.